Fakaalofa Lahi Atu and Welcome to the Official Statistics Niue Website
Population
1, 681
Census 2022
Visitors
1,302
Jan – Dec 2020
CPI
8.70%
December 2023
GDP
$38M
June 2021
Latest News
Consumer Price Index 2024
The consumers price index (CPI) is a measure of inflation for the households of Niue. It records changes in the price of goods and servicesNiue Statistics Office officially rebased CPI as of June 2018, the last time this was done was 15 years prior based on the...
Consumer Price Index 2023
The consumers price index (CPI) is a measure of inflation for the households of Niue. It records changes in the price of goods and servicesNiue Statistics Office has officially rebased CPI as of June 2018, the last time this was done was 15 years prior based on the...
Consumer Price Index 2022
The consumers price index (CPI) is a measure of inflation for the households of Niue. It records changes in the price of goods and servicesNiue Statistics Office has officially rebased CPI as of June 2018, the last time this was done was 15 years prior based on the...
Consumer Price Index 2021
The consumers price index (CPI) is a measure of inflation for the households of Niue. It records changes in the price of goods and servicesNiue Statistics Office has officially rebased CPI as of June 2018, the last time this was done was 15 years prior based on the...
Niue Census of Population and Housing, 2022
Statistical Release: Niue Census of Population and Housing, November 2022 Preliminary Report On Friday 11th of November 2022, the Niue Statistics Office conducted the enumeration of the 11th National Population and Household census since 1971 under Niue’s Act. This...
Niue Vital Statistics 2022
STATISTICAL RELEASE: Vital Statistics for the year 2022 Vital statistics are an essential input for the planning of human development. Knowledge of the size and characteristics of a country’s population on a timely basis is a prerequisite to socioeconomic planning....
Niue Vital Statistics 2021
STATISTICAL RELEASE: Vital Statistics for the year 2021 Vital statistics are an essential input for the planning of human development. Knowledge of the size and characteristics of a country’s population on a timely basis is a prerequisite to socioeconomic planning....
National Accounts Estimates of Niue 2021
Statistical release: Niue Gross Domestic Product: 2020-2021 This release or report reflects some revisions to the Niue national accounts up to 2021 with the availability of more unaudited and audited government accounts and other administrative records.National...
National Accounts Estimates of Niue 2020
Statistical release: Niue Gross Domestic Product: 2019-2020 This release or report reflects some revisions to the Niue national accounts up to 2020 with the availability of more unaudited and audited government accounts and other administrative records.National...
International Merchandise and Trade 2021
International merchandise trade plays a crucial role in economic development, binding producers and consumers located in different countries into a global economic system. The availability of timely, high quality international trade statistics is therefore vital for...
Upcoming Events
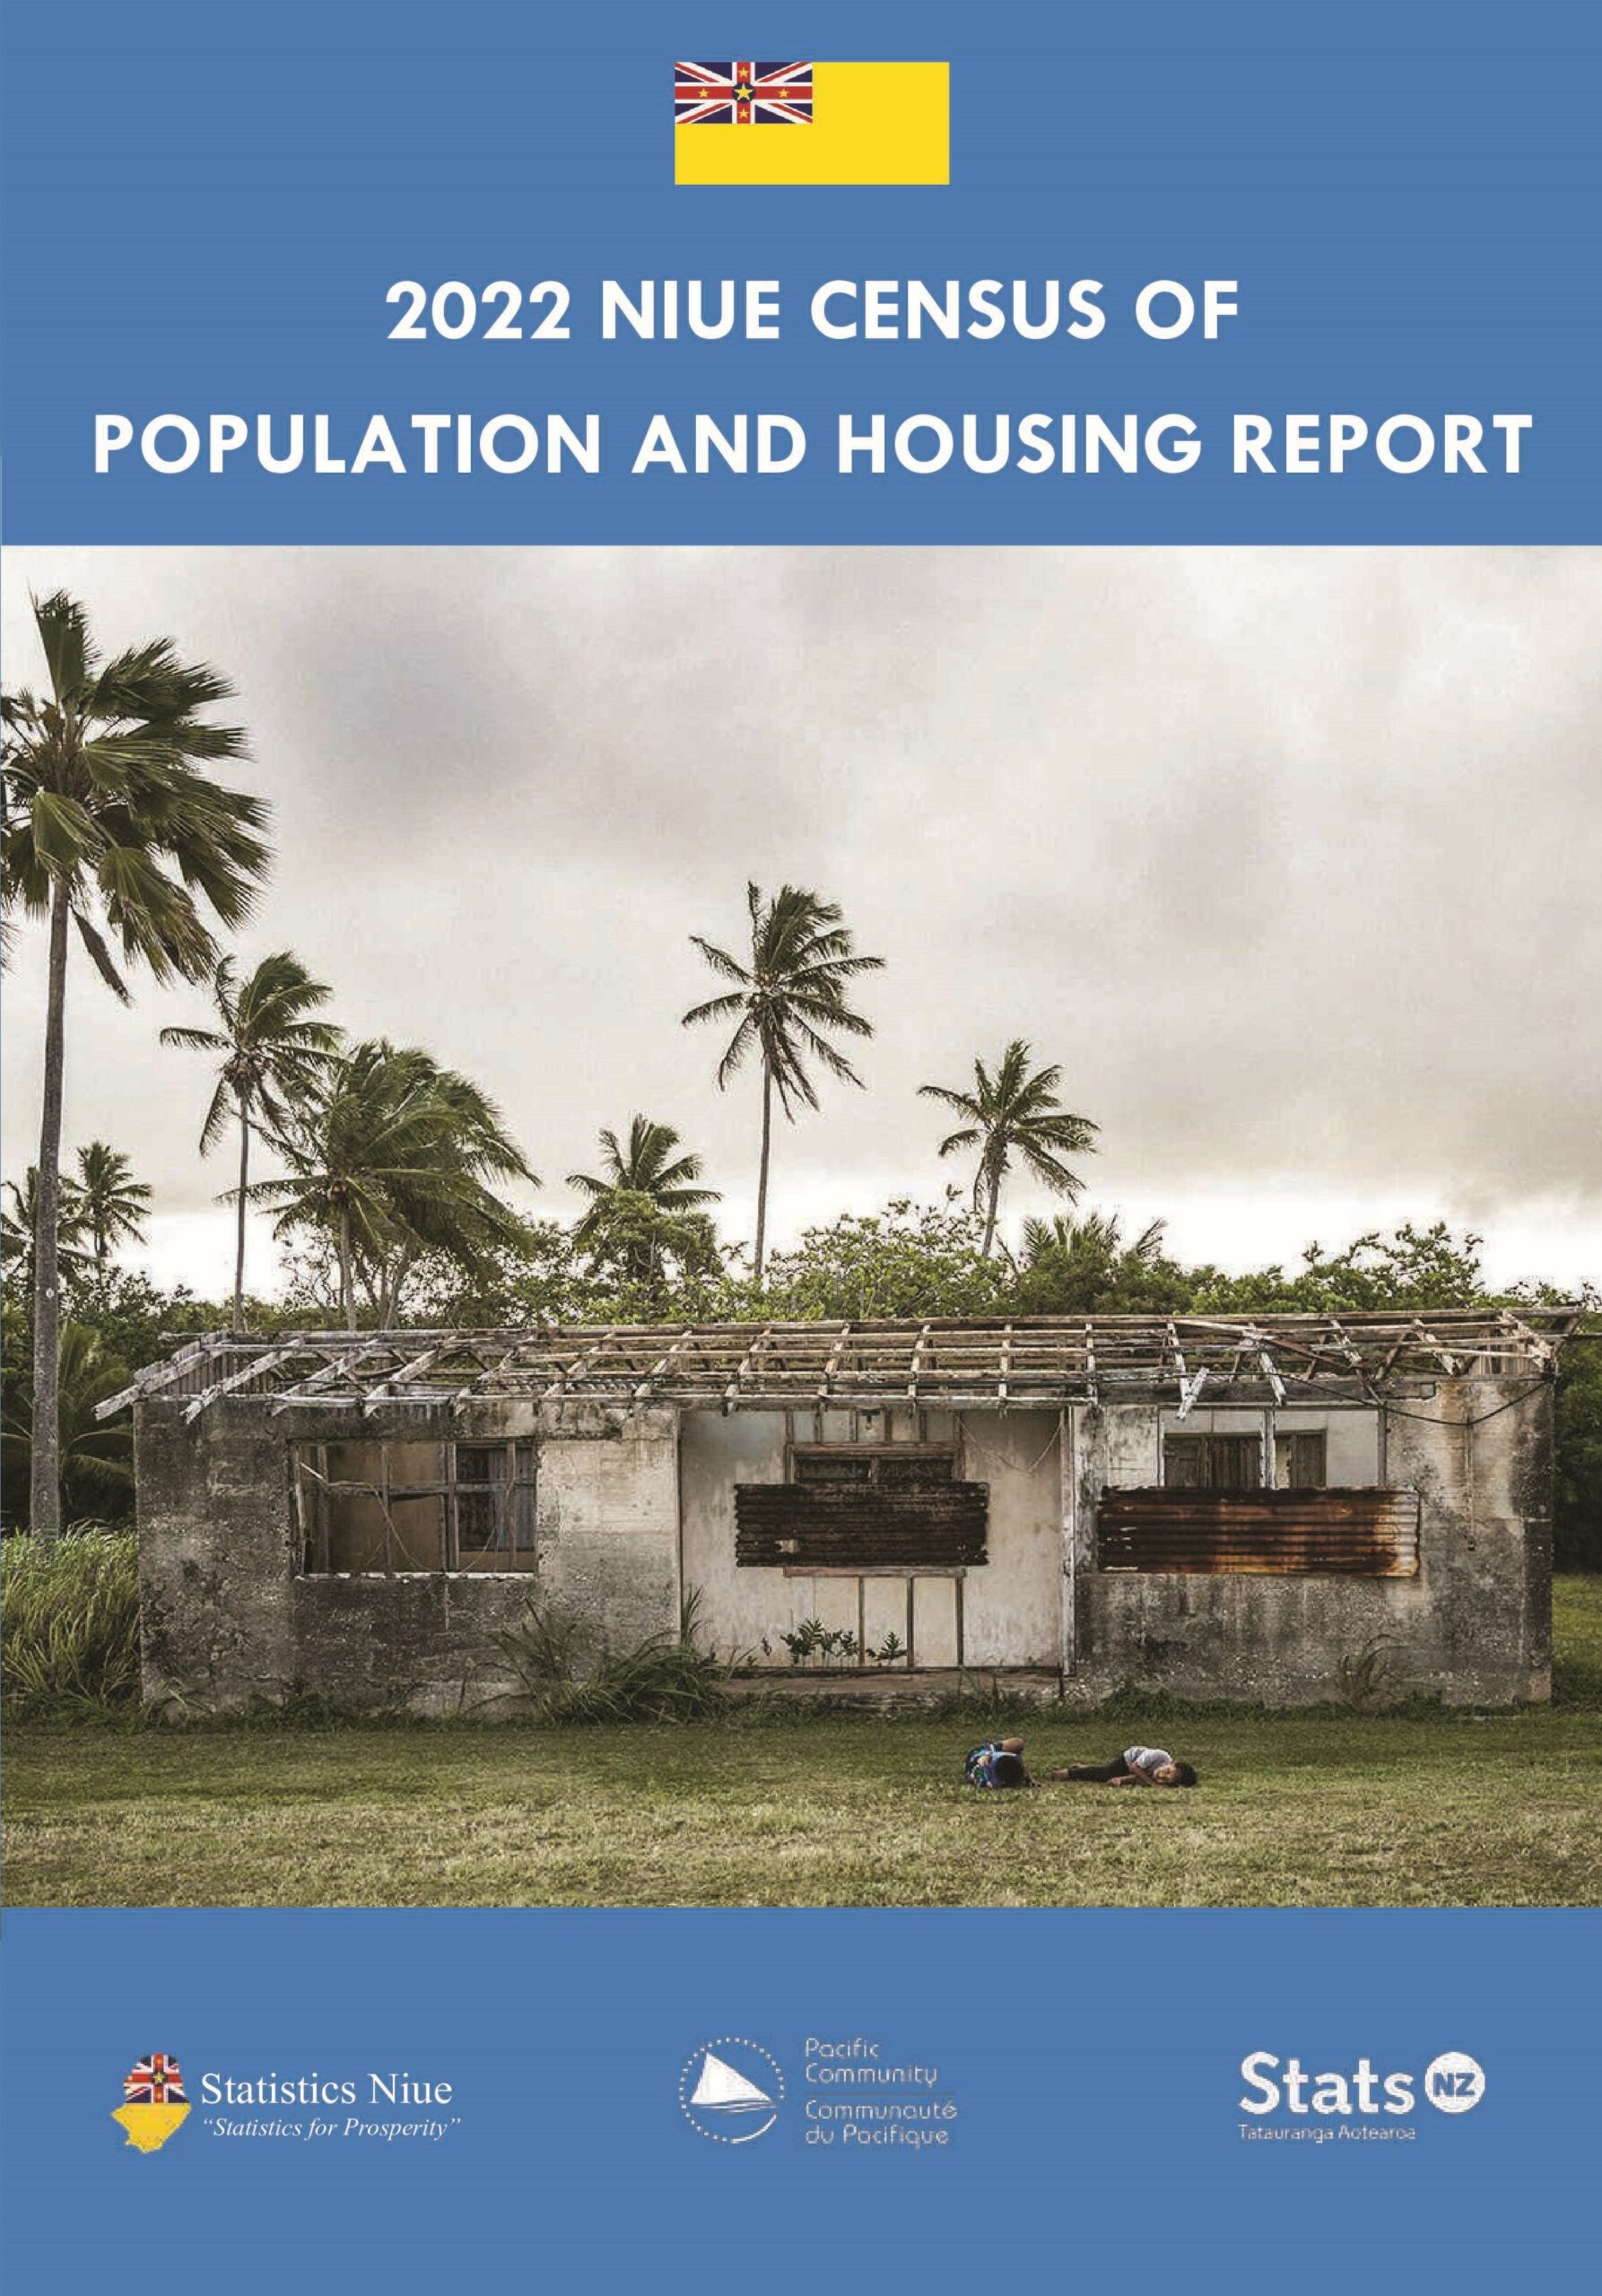
Release of the 2022 Niue Population and Housing Census Report
The Minister along with the Niue Statistics Office are proud to officially release the report for the 2022 Population and Household Census.
The report is available for download here
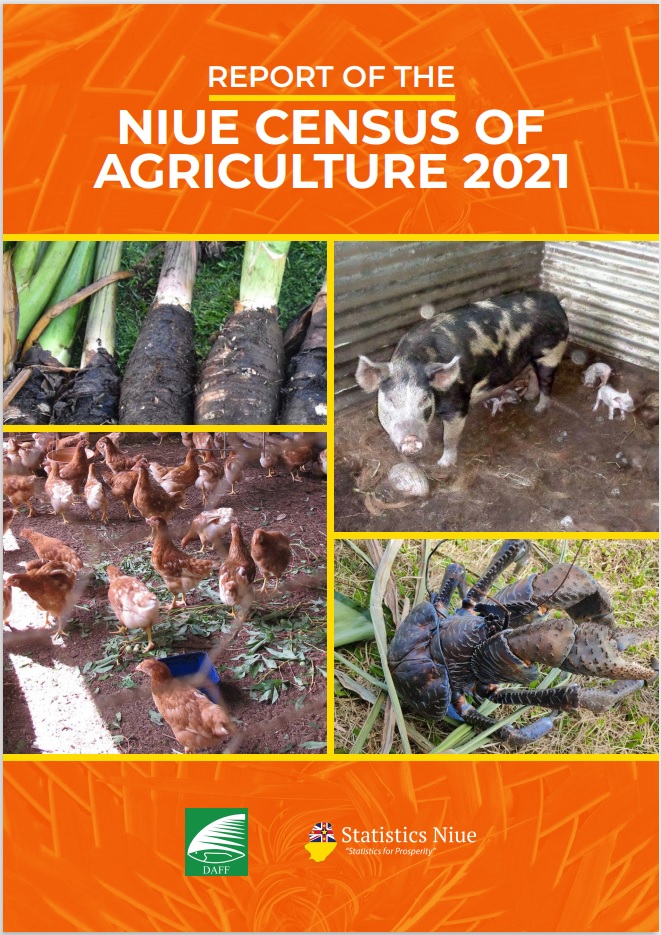
Release of the Niue Census of Agriculture2021 Report
The Minister along with the Niue Statistics Office are proud to officially release the report for the Niue Census of Agriculture 2021.
The report is available for download here


Agriculture Census Postponed
The enumeration phase for the collection of the Agriculture Census has been postponed from November 2019 to be conducted in March 2020.

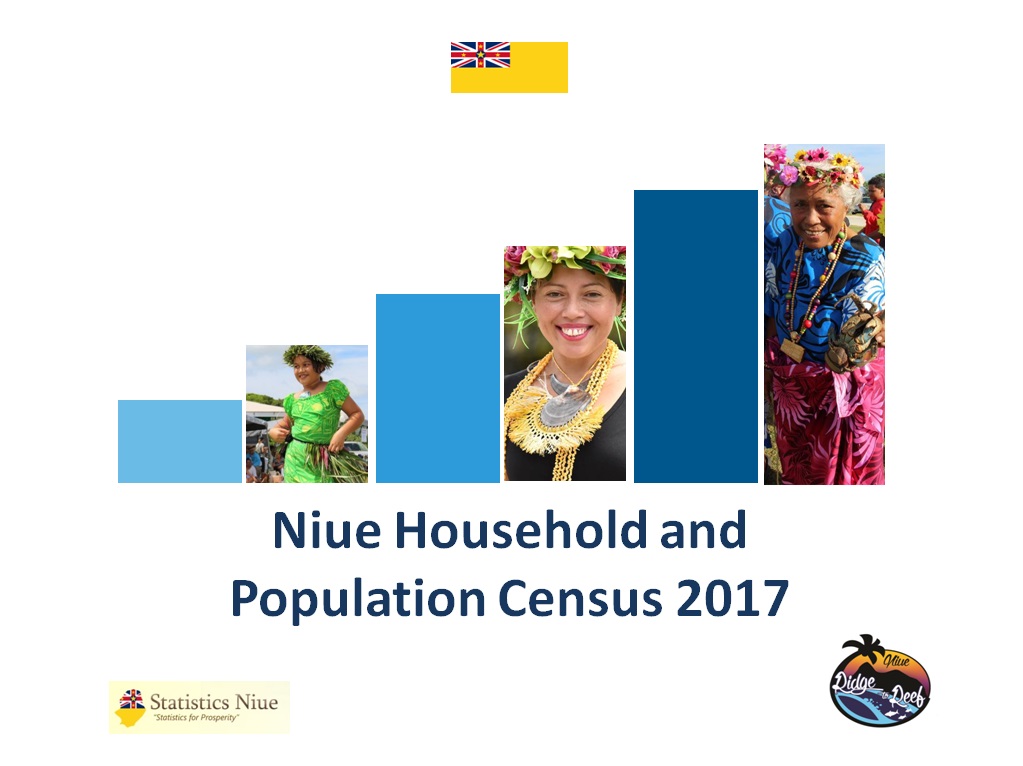
2017 Household and Population report release
The Minister and the staff of the Niue Statistics Office are proud to release the report for the Niue Household and Population Census 2017.
You can access the report here

2019 Agriculture Census
The Statistics office, in collaboration with the Department of Agriculture, Forestry, and Fisheries, and support from FAO, are planning to conduct an Agriculture Census in November 2019


